This page is the application’s statistical over view for the Human Resources operations. If you want to view a display of your organization’s processes; Dashboard is the right place.
This page displays data in the form of panels.
Cards
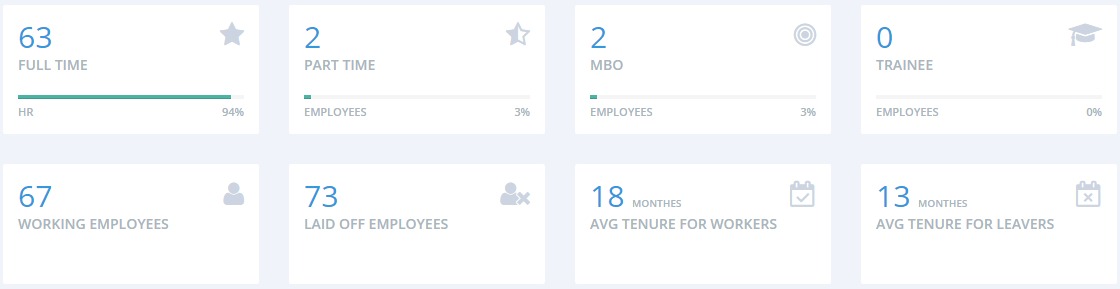
Contract Types
- Full Time
- Part Time
- MBO
- Trainee
Employment Statuses
- Working Employees
- Laid Off Employees
- Avg Tenure for Workers
- Avg Tenure for Leavers
Attendance Panel
Use the date range filter, and employees will be listed below each tab with their data.
The count of times when employees didn’t come to work without sending a request to their heads; absence without previous permission.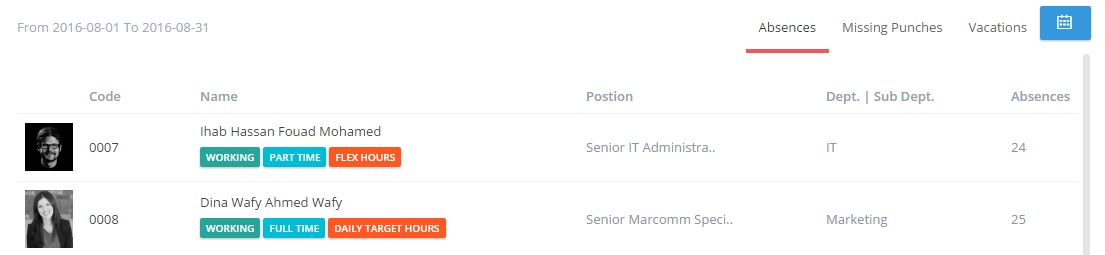
The count of punches that employee have forgotten to punch in working days; when they have actually attended.
The count of vacation days taken by employees in each and every vacation type.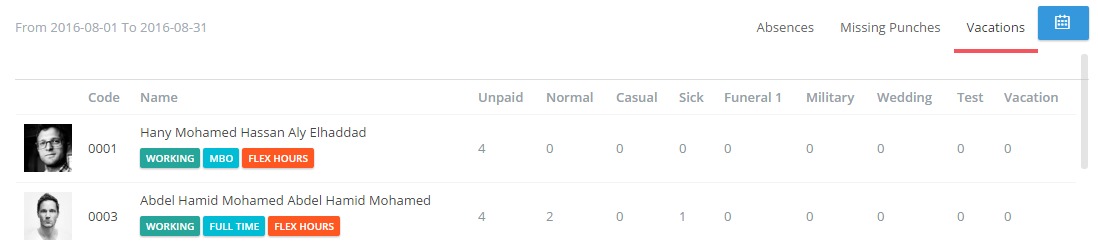
Employees Panels
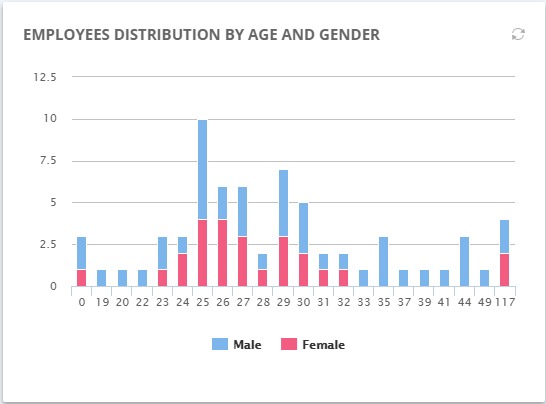
A column chart that views the number of employees divided to both males and females, in addition to their ages.
A bar chart that views the number of employees in each and every department separately.

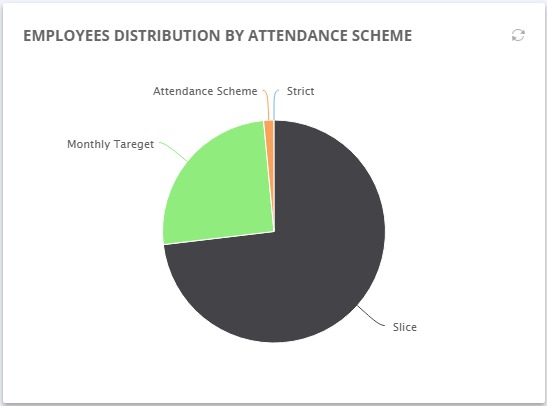
A pie chart that views the number of employees following each and every attendance scheme separately.
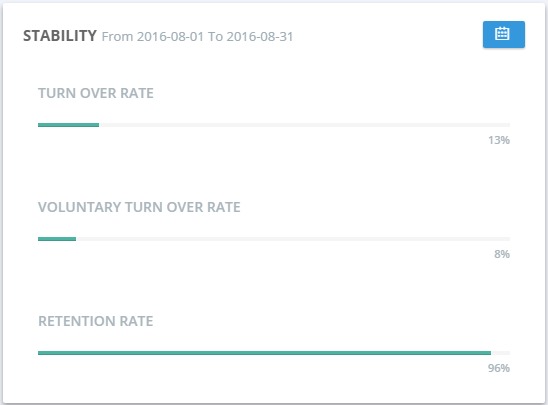
A percentage bar chart that views employees’ stability within a specific date range; how long do employees stay/work in your organization and whether they resign or were terminated.