This page is the application’s statistical over view for the Compensation and Benefits operations. If you want to view a display of your organization’s processes; Dashboard is the right place.
The page displays data in the form of panels.
Payroll Panels
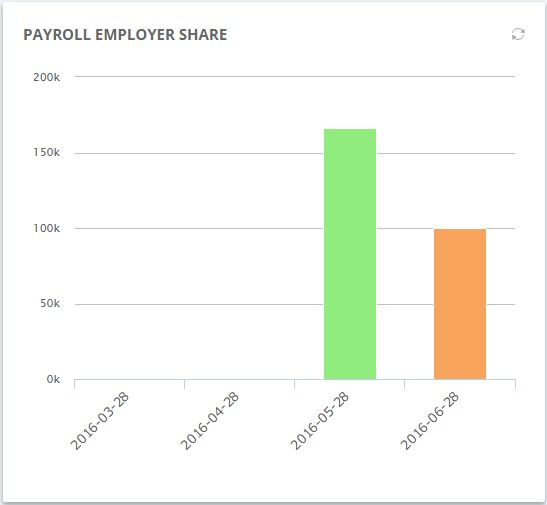
A column chart that views the amount of money paid by the employer during generated payroll cycles.
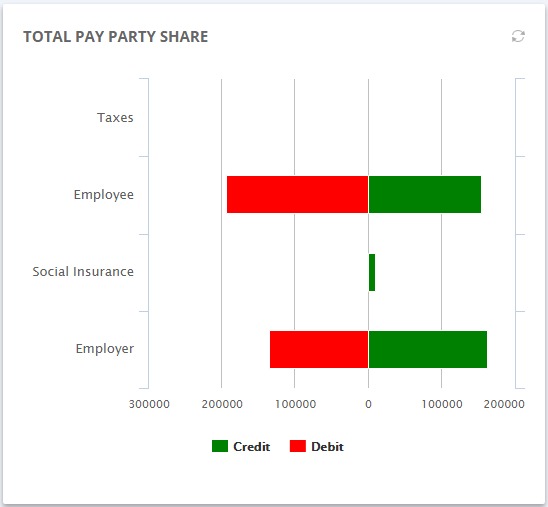
A bar chart that views the amount of money paid by each and every pay party, whether it was debit or credit.
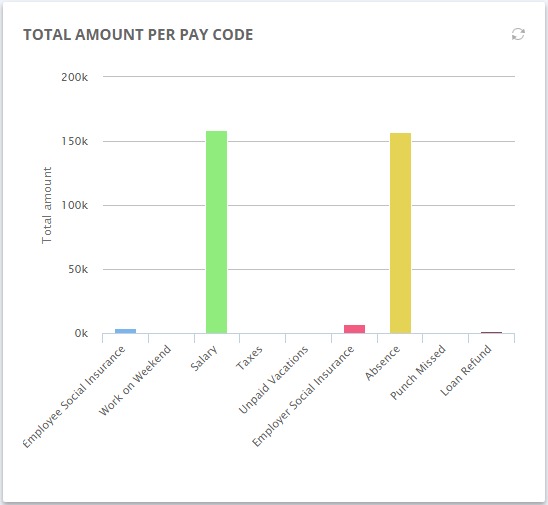
A column chart that views the amount of money spent on each and every pay code in the last calculated payroll cycle.
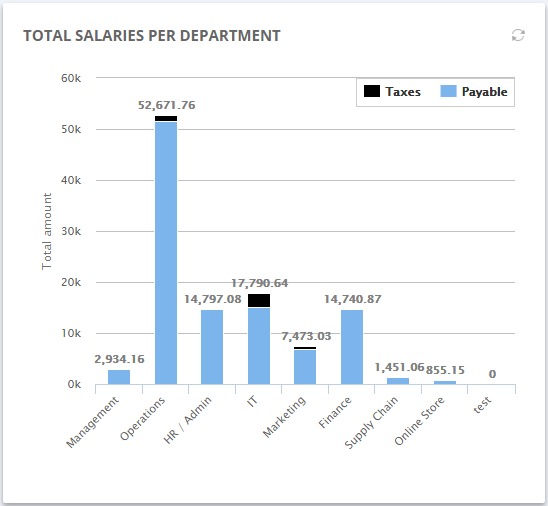
A column chart that views the amount of money paid as salaries for each and every department in the last calculated payroll cycle.
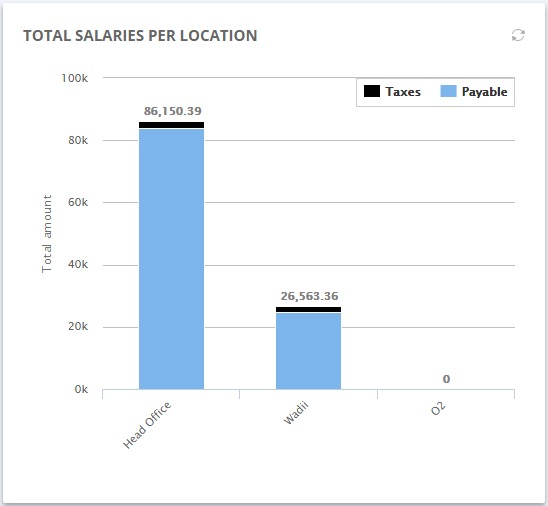
A column chart that views the amount of money paid as salaries for each and every location/branch in the last calculated payroll cycle.
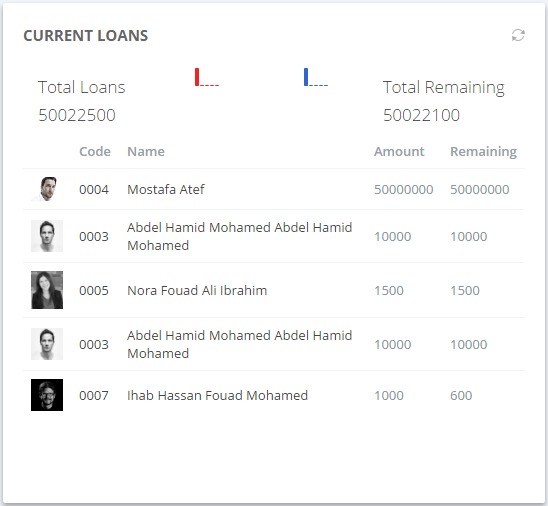
A panel that views the amount of money that is loaned by employees in the last calculated payroll cycle.
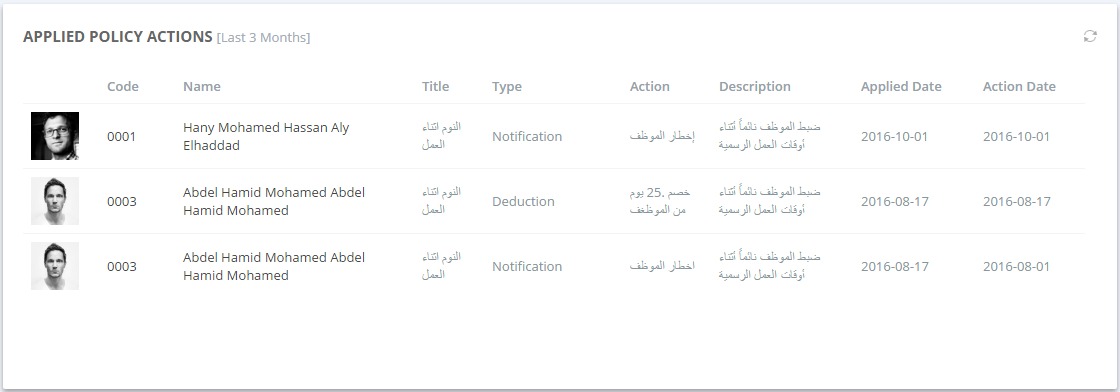
A panel that views the policy actions applied on employees in the last three months.